Operational results GRI
CSRC’s core business group is Carbon Black. In 2024, CSRC recorded consolidated revenue of approximately NT$18.06 billion, with earnings per share (EPS) of negative NT$2.80. The Carbon Black business contributed NT$17.78 billion in revenue, accounting for 98% of the full-year total. Geographically, sales were concentrated in the Americas and Asia, representing 35% and 62% of total sales, respectively.
In 2024, geopolitical risks continued to escalate. Under a high-interest-rate environment, global economic performance diverged across regions. In CSRC’s key operating markets, Taiwan remained relatively stable. However, U.S. consumer demand for cars remained weak due to inflationary pressures; India faced competition from low-priced imports; and in mainland China, an oversupply of Carbon Black intensified market competition. Furthermore, increasing imports of Carbon Black from Russia further exacerbated the supply-demand imbalance, putting additional pressure on the Carbon Black business.
Looking ahead, CSRC has streamlined its operations in mainland China, with each plant focusing on standardized production of niche, high-value products. The company continues to integrate group-wide technologies to secure competitively advantaged feedstock. On the product side, CSRC is expanding into export markets and non-tire applications. On the business side, efforts are focused on engaging and expanding first-tier customer relationships to seize growth opportunities.
In response to international automakers and tire manufacturers setting targets for sustainable material usage, CSRC, as a tire raw material supplier, has developed corresponding strategies and actions. These include the development of high-durability (high-wear resistance) and low rolling resistance tire formula; production of Eco-circular Carbon Black; partnerships for recycled pyrolysis oil; development of bio-based Carbon Black; and other advanced carbon materials. CSRC is also co-developing a circular supply chain with waste tire pyrolysis partners to promote recycled feedstock reuse and actively build a green, sustainable enterprise.
CSRC is committed to staying ahead of environmental regulations by strengthening its pollution control systems and ensuring compliance with local environmental standards. Despite tightening regulations in various countries, CSRC has continued its operations and production, sustaining growth. Guided by the principles of “results-oriented,” “precise,” “simple,” and “accurate” operations, CSRC will continue to promote R&D projects aimed at developing energy-saving equipment and methods, reducing emissions, and improving resource efficiency—creating positive growth momentum and striving to maximize value for its shareholders.
Sales by business group over the years
| Unit: NTD million |
|
Carbon black |
Biotechnology(Note) |
Others |
| 2024 |
17,779 |
- |
281 |
| 2023 |
17,416 |
225 |
234 |
| 2022 |
21,724 |
1,333 |
311 |
Note: The biotechnology royalty patent rights expired in Q1 2023, consequently no revenue was recognized in 2024. For detailed explanations, please refer to pages 120-121 of the 2024 Annual Shareholders' Meeting Report. Regarding the financial performance of the biotechnology segment, please see Note 40 (Segment Information) on page 76 of Chapter 9 in the 2024 Consolidated Financial Statements.
Sales by region over the years
| Unit: NTD million |
|
Americas |
Asia |
Others |
| 2024 |
6,398 |
11,116 |
547 |
| 2023 |
7,126 |
9,842 |
907 |
| 2022 |
11,044 |
11,294 |
1,030 |
Direct economic value generated and distributed by CSRC
| Unit: NTD million |
|
2022 |
2023 |
2024 |
| Production of direct economic value |
Revenue |
23,368 |
17,875 |
18,060 |
| Distribution of direct economic value |
Operating costs |
20,042 |
16,221 |
17,235 |
| Employee remuneration and benefits |
1,586 |
1,503 |
1,399 |
| Payments to investors |
692 |
788 |
842 |
| Payments to the government |
176 |
135 |
180 |
| Community investment |
1 |
- |
- |
|
| Retained economic value |
871 |
(772) |
(1,596) |
Government financial subsidies
| Unit: NTD |
| Region |
Greater China |
Total |
| Taiwan |
China |
| Tax deduction |
11,000 |
572,526 |
583,526 |
| Subsidy |
6,121,114 |
10,845,034 |
16,966,148 |
| R&D subsidies |
- |
- |
- |
| Financial rewards |
- |
3,539,185 |
3,539,185 |
| Total subsidy amount |
6,132,114 |
14,956,745 |
21,088,859 |
Note: No government financial subsidies were received from India and the United States in 2024.
Tax Policy
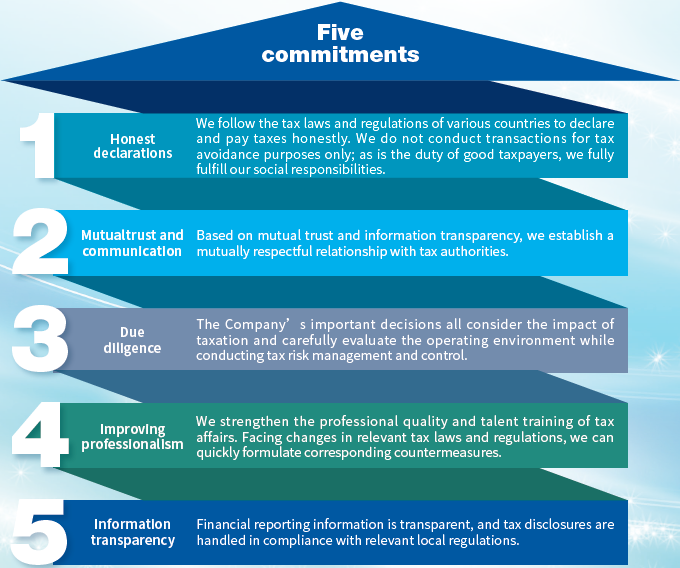
CSRC is committed to information transparency and regulatory compliance in its tax policy and risk management. It formulates relevant tax policies in response to international trends in tax governance, effectively controlling tax risks and implementing sustainable corporate development to enhance shareholder value. The Board of Directors serves as the highest decision-making and oversight body for tax governance. Major transactions undergo appropriate assessments to facilitate management and control of tax risks. Regular reviews of the tax status of Group companies include examining the overall investment structure, operational and transaction activities, functional roles and risk allocations, international tax law changes, and engaging external experts to assist in assessing Company risks, ensuring tax compliance, and addressing potential tax risks. CSRC proactively communicates and discusses with tax authorities regarding ambiguities in the application of tax laws. Upon receiving correspondence from tax authorities, the Company fully cooperates by providing requested information, aiming to establish a relationship of mutual respect with tax authorities and a mechanism for building trust and communication with stakeholders
CSRC has operating locations all over the world. Therefore, following local tax laws is the highest principle. To support government measures to promote enterprise innovation, research and development, and economic growth, we perform our corporate citizenship responsibilities.
CSRC's tax situation in each country/region
| Unit: NTD thousand |
| Region |
Taiwan |
China |
India |
United States |
Total |
| Operating revenue |
3,648,494 |
3,155,189 |
4,374,626 |
6,881,579 |
18,059,888 |
| Proportion (%) |
20% |
17% |
24% |
38% |
100% |
| Profit and loss before tax |
(326,451) |
(1,842,669) |
(492,320) |
194,116 |
(2,467,324) |
| Proportion (%) |
13% |
75% |
20% |
(8%) |
100% |
| Income tax payable for the current year |
125,977 |
0 |
0 |
135,866 |
261,843 |
| Proportion (%) |
48% |
0% |
0% |
52% |
100% |
| Income tax number of payments |
125,977 |
0 |
0 |
135,866 |
261,843 |
| Proportion (%) |
48% |
0% |
0% |
52% |
100% |
Income taxes
| Unit: NTD thousand |
| Financial Disclosures |
2022 |
2023 |
2024 |
| Net profit before tax |
1,472,526 |
(114,638) |
(2,467,324) |
| Income tax expense |
809,544 |
428,067 |
425,913 |
| Income tax paid |
87,458 |
472,264 |
261,843 |
Effective tax rate
| Unit:% |
| Year |
2022 |
2023 |
2024 |
|
Effective tax rate on book basis (%)Note 1
|
55% |
(373%) |
(17%) |
|
Effective tax rate on cash basis (%)Note 2
|
6% |
(412%) |
(11%) |
| Note 1 |
Effective tax rate on book basis (%) = Income tax expense / Profit before tax |
| Note 2 |
Effective tax rate on cash basis (%) = Income tax paid / Profit before tax |
| Note 3 |
Tax-related information can be found in Note 27 of Chapter 9, "Income Taxes on Continuing Operations," on page 57 of the 2024 consolidated financial statements. |