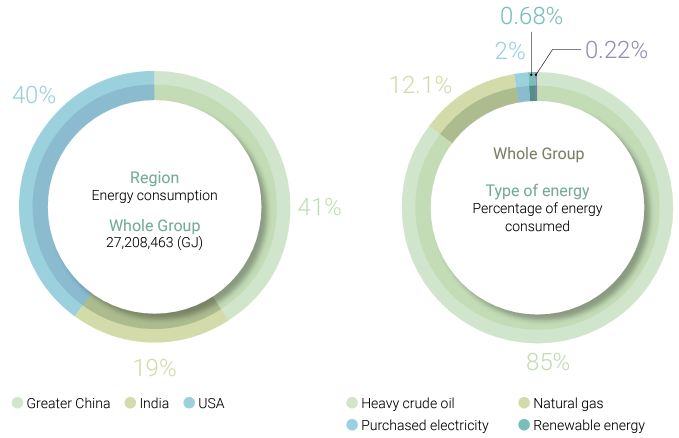
In the process of manufacturing carbon black, CSRC primarily uses energy sources including heavy oil, purchased electricity, natural gas, diesel, self-generated electricity, and process tail gas. Some plants also utilize renewable energy. In 2024, the group’s total internal energy consumption reached 30,123,170 GJ, with Greater China accounting for 36%, India 28%, and the United States 36%. Although the total carbon black production increased compared to 2023—resulting in higher overall energy consumption—the plants continued to improve process technologies and recover waste heat to maintain the group’s energy intensity. In 2024, the group’s overall energy intensity was 77 GJ per metric ton of product. The regional energy intensities were 71 GJ/ton in Greater China, 73 GJ/ton in India, and 88 GJ/ton in the United States.
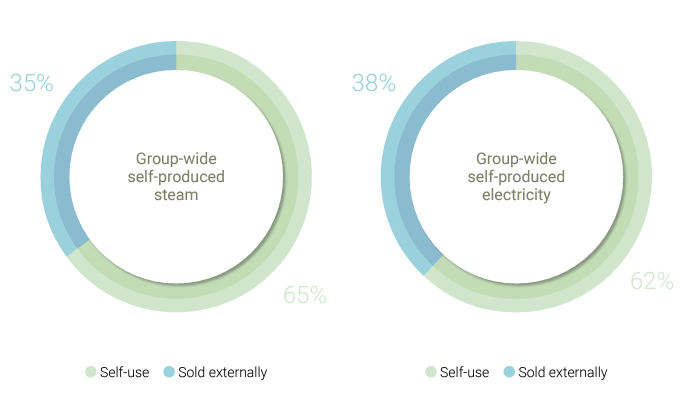
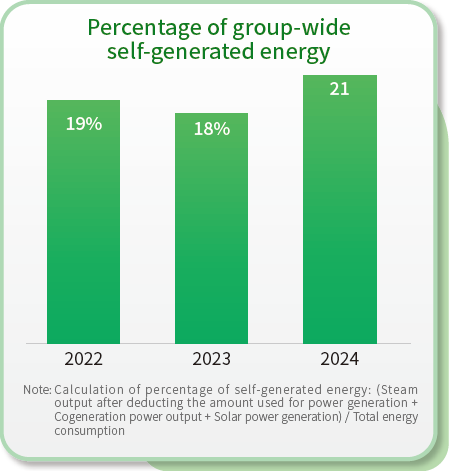
Regarding self-use ratios of steam and electricity in 2024, Greater China had 39.8% steam self-generation and self-use, and 73.2% self-use of self-generated electricity. India had 90% steam self-generation and self-use, and 58.4% self-use of self-generated electricity. The United States had 1.9% steam self-generation and self-use, and 74.7% self-use of self-generated electricity. For the entire group, steam selfgeneration and self-use accounted for 51.7%, while self-use of self-generated electricity was 67.9%.
CSRC will continue to track each operating plant’s carbon black output, gas output and electricity consumption per ton of carbon black, power generated per unit of steam, boiler use status, and steam feedwater quality for energy use efficiency management, while repairing and maintaining equipment to ensure that the equipment is operating with high energy efficiency.
Energy consumption by region over the past three years
| Category | Greater China | India | USA | Group | |||||||||
|---|---|---|---|---|---|---|---|---|---|---|---|---|---|
| 2022 | 2023 | 2024 | 2022 | 2023 | 2024 | 2022 | 2023 | 2024 | 2022 | 2023 | 2024 | ||
| Heavy crude oil | 12,869,061 | 10,307,568 | 9,980,383 | 4,200,306 | 5,153,092 | 8,383,299 | 9,186,073 | 7,751,492 | 7,707,190 | 26,255,440 | 23,212,152 | 26,070,872 | |
| Purchased electricity | 364,588 | 263,116 | 222,661 | 798 | 57,397 | 39,037 | 127,573 | 150,864 | 88,658 | 492,959 | 471,376 | 350,356 | |
| Purchased renewable power | 0 | 0 | 0 | 0 | 0 | 0 | 52,967 | 22,172 | 88,658 | 52,967 | 22,172 | 88,658 | |
| Biomass fuel | 238,682 | 163,855 | 132,091 | 0 | 0 | 0 | 0 | 0 | 0 | 238,682 | 163,855 | 132,091 | |
| Natural gas | 281,619 | 311,568 | 500,733 | 151 | 26,745 | 8,108 | 2,291,546 | 2,955,965 | 2,951,606 | 2,573,315 | 3,294,277 | 3,460,447 | |
| Diesel | 11,241 | 11,938 | 6,107 | 12,068 | 7,640 | 7,166 | 1,278 | 6,895 | 7,473 | 24,587 | 26,473 | 20,746 | |
| Total internal energy consumption | 13,765,191 | 11,058,045 | 10,841,975 | 4,213,323 | 5,244,874 | 8,437,610 | 11,659,437 | 10,887,388 | 10,843,585 | 29,637,950 | 27,190,305 | 30,123,170 | |
| Energy intensity (GJ/ton) | 74 | 72 | 71 | 77 | 74 | 73 | 87 | 87 | 88 | 79 | 78 | 77 | |
| Process tail gas | 3,203,701 | 2,614,760 | 2,650,780 | 955,290 | 1,297,980 | 1,419,474 | 2,039,393 | 2,048,016 | 2,029,966 | 6,198,384 | 5,960,756 | 6,069,220 | |
| Self-generated steam | Self-use | 1,723,522 | 1,443,166 | 650,172 | 55,995 | 1,105,775 | 2,096,862 | 52,486 | 44,637 | 26,126 | 1,832,003 | 2,593,578 | 2,773,160 |
| Sold externally | 1,596,774 | 1,269,678 | 985,414 | 120,137 | 118,098 | 232,256 | 1,205,581 | 1,096,313 | 1,377,640 | 2,922,492 | 2,484,089 | 2,595,310 | |
| Self-generated electricity | Self-use | 190,180 | 185,416 | 193,688 | 128,527 | 59,901 | 250,301 | 336,996 | 307,396 | 296,113 | 655,703 | 552,683 | 740,102 |
| Sold externally | 35,735 | 35,663 | 70,849 | 121,177 | 144,180 | 178,624 | 227,729 | 165,639 | 100,297 | 384,641 | 345,482 | 349,770 | |
- There are two sources of process tail gas. One is the tail gas from the pyrolysis of the oil used to produce carbon black. The tail gas consists of H2, C2H2, CH2, and CO, and is flammable; the other source is the carbon black gas after the carbon black in the gas-solid phase generated during combustion is separated from gas-solid separation in the baghouse dust collector. The carbon black gas, plus the aforementioned tail gas from the pyrolysis of the oil can be collected using a tail gas recirculation method for use in the pelleted carbon black drying and steam boiler.
- The total internal energy consumption is calculated based on the actual fuel and energy types used, including heavy oil, purchased electricity, purchased renewable electricity, biomass fuel, natural gas and diesel. Process tail gas, self-generated steam, and self-generated electricity are all products after burning raw material oil, they are excluded from the calculation to avoid double counting of energy consumption.
- The calorific value coefficients for energy conversion are calculated with reference to the coefficients announced by the Bureau of Energy, Ministry of Economic Affairs in 2024. For process tail gas, since the process conditions are similar in each plant, the calorific value is based on the 2024 tail gas composition analysis of the Linyuan Advanced Plant, which is 644.2 kcal/m3. For the three plants in mainland China 's established according to China's national emission standard.
- Energy intensity refers to the energy consumption (GJ) per unit of carbon black production (tons). It is calculated as energy intensity = total internal energy consumption ÷ 2024 carbon black production. The Group' s 2024 carbon black production totaled 391,502 tons, with 152,998 tons in Greater China, 115,965 tons in India, and 122,539 tons in the United States. In addition to four production bases, the Greater China region also includes Xieyuan and the Taipei Headquarters.
- In 2024, Greater China switched from fuel oil to natural gas for carbon reduction, thus increasing natural gas usage.
- Diesel and steam energy consumption in the US plants for 2023 were recalculated and corrected this year due to unit conversion errors.
Energy intensity in various regions over the past three years
Energy management
Energy structure management primarily focuses on adjusting towards a circular economy model. Examples include recovering process tail gas to convert into steam for power generation used internally and externally, installing solar power systems to increase renewable energy production, and using biomass fuels to reduce greenhouse gas emissions as part of energy-saving and carbon reduction initiatives. Improving energy use efficiency mainly involves enhancing equipment electricity efficiency, maximizing value by reusing heat energy, reducing purchased electricity demand, and regularly maintaining and replacing major equipment to sustain heat exchange efficiency.
To improve energy management performance, CSRC regularly compiles energy usage data from all operating sites to guide adjustments in energy policies. All related data are audited by the Management Department to ensure accuracy. The General Manager and Chief Strategy Officer participate periodically in these meetings to guide the company’s operational direction on energy conservation and emission reduction.
In 2024, CSRC total power generation from energy-saving projects related to energy structure management across all operating sites was approximately 304,284.1 MWh, including 1,610.7 MWh from renewable energy generation. For energy efficiency improvement projects, modifications to the reactor air preheater increased heat exchange area and efficiency, resulting in a total reduction of 4,677.6 tons CO2e in greenhouse gas emissions.
All operating sites will continue to enhance their energy management capabilities. Since 2023, they have planned system assessments for replacing fuel oil with natural gas and renewable oil products. By gradually replacing high-emission fuel oils, the plan effectively reduces greenhouse gas emissions. The implementation of this plan in 2024 is expected to reduce emissions by a total of 14,588 tons CO2e.
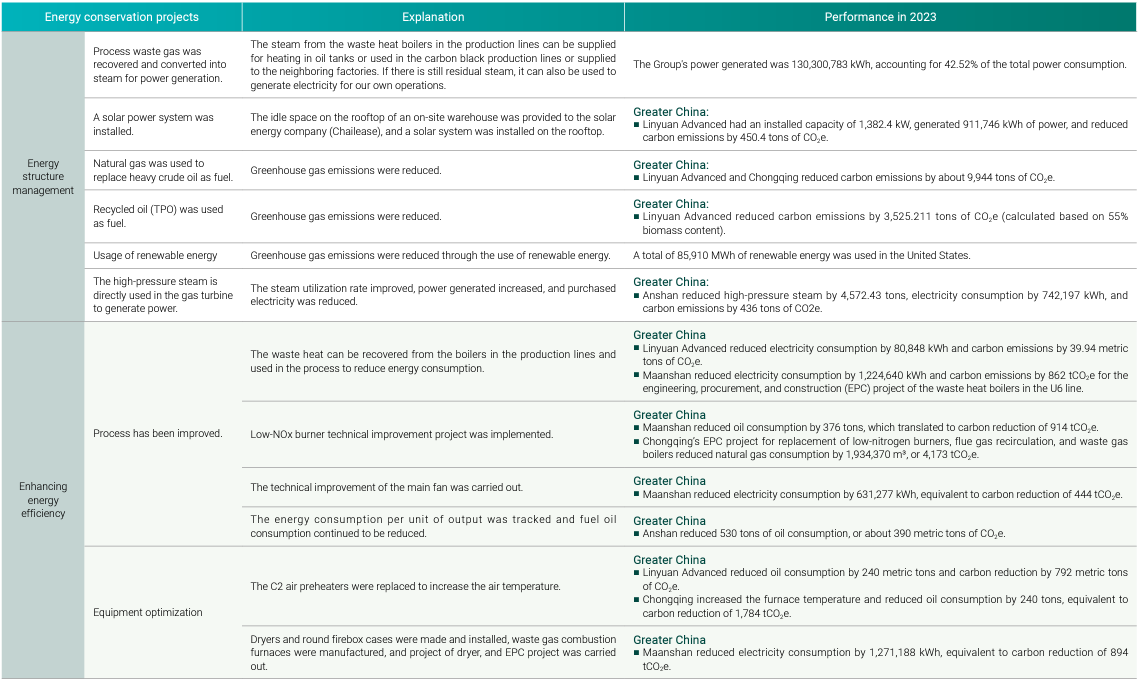
Group-wide energy conservation and carbon reduction projects in 2024
| Energy conservation projects | Description | Performance in 2024 | |
|---|---|---|---|
| Energy structure management | Process tail gas was recovered and converted into steam for power generation. | The steam from the waste heat boilers in the production lines can be supplied for heating in oil tanks or used in the carbon black production lines or supplied to the neighboring factories. If there is still residual steam, it can also be used to generate electricity for our own operations. | The Group's power generated was 302,673,400 kWh, accounting for 92.4% of the total power consumption. |
| A solar power system was installed. | The idle space on the rooftop of an on-site warehouse was provided to the solar energy company (Chailease), and a solar system was installed on the rooftop. |
Greater China
|
|
| Natural gas was used to replace heavy crude oil as fuel. | Greenhouse gas emissions were reduced. |
Greater China
|
|
| Recycled oil (TPO) was used as fuel. | Greenhouse gas emissions were reduced. |
Greater China
|
|
| Usage of renewable energy | Greenhouse gas emissions were reduced through the use of renewable energy. |
United States A total of 22,246 MWh of renewable energy was used in the United States. |
|
| Enhancing energy efficiency | Process has been improved. | The main blower was modified to a steam turbine, and the steam condensate was recovered. |
India
|
| Tracking Energy Consumption per Unit of Major Products and Ongoing Oil-Saving Efforts |
Greater China
|
||
| Upgrading C2 Air Preheater to Increase Air Temperature |
Greater China
|
||
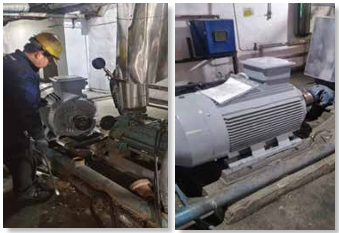
| Equipment optimization | Re-selection of rotating equipment, redesign of impellers for wind turbines and pumps with overcapacity design. |
United States
|
|
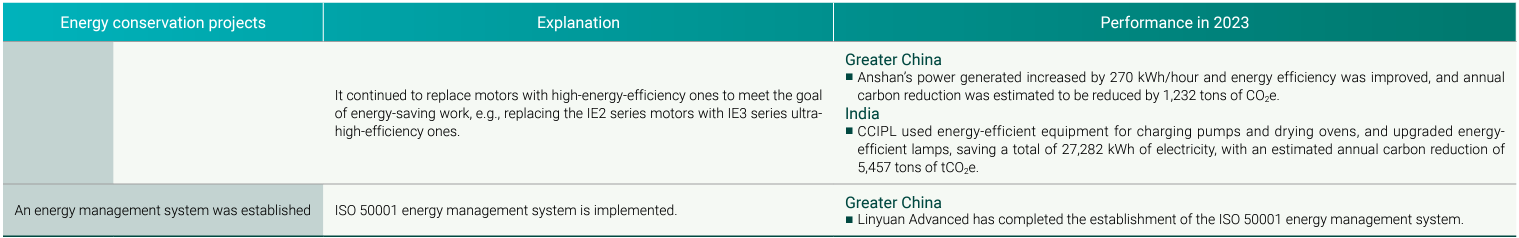
| Ongoing Replacement with High-Efficiency Energy-Saving Motors such as replacing wind turbine motors with ultra-high efficiency electric motors, etc. |
India
|
||
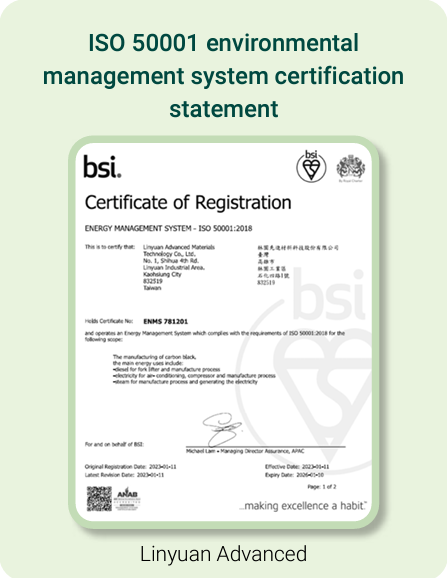
| Implementation of the ISO 50001 Energy Management System | ISO 50001 energy management system is implemented. |
Greater China Linyuan Advanced has completed the establishment of the ISO 50001 energy management system. |
|
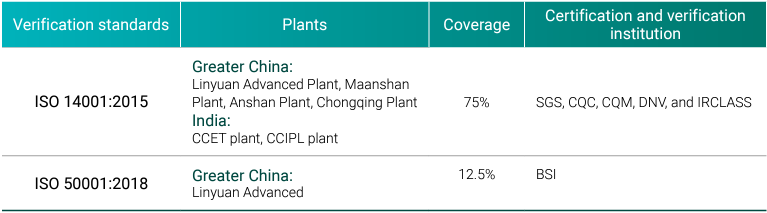
Coverage of production and operation sites adopting environmental sustainability-related ISO management system standards:
| Verification standards | Plants | Group coverage | Certification and verification institution |
|---|---|---|---|
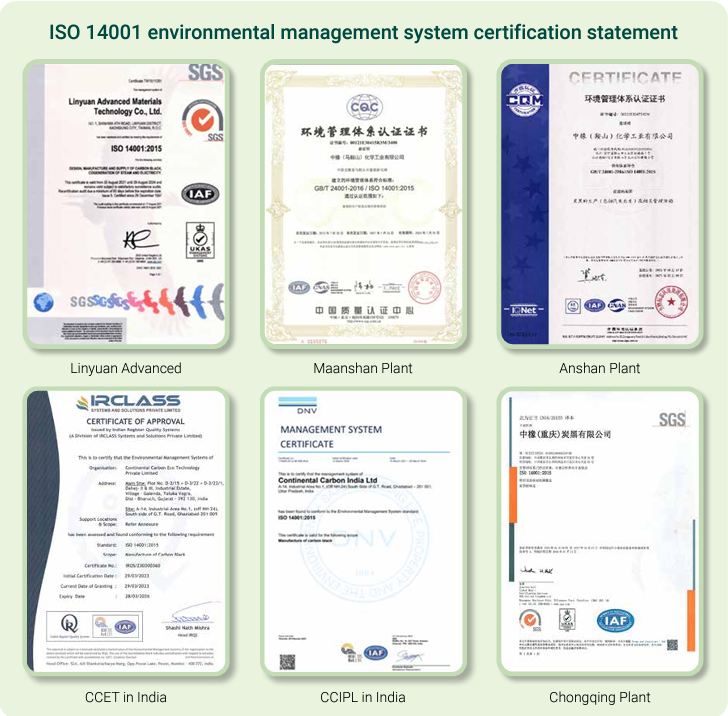
| ISO 14001:2015 |
Greater China: Linyuan Advanced Plant, Maanshan Plant, Anshan Plant, Chongqing Plant India: CCET plant, CCIPL plant |
75% |
GCL、CQC、 CQM、SGS、 IRCLASS、DNV |
| ISO 50001:2018 |
Greater China: Linyuan Advanced |
12.5% | BSI |
ISO 14001 energy management system certification statement
Greenhouse gas inventories
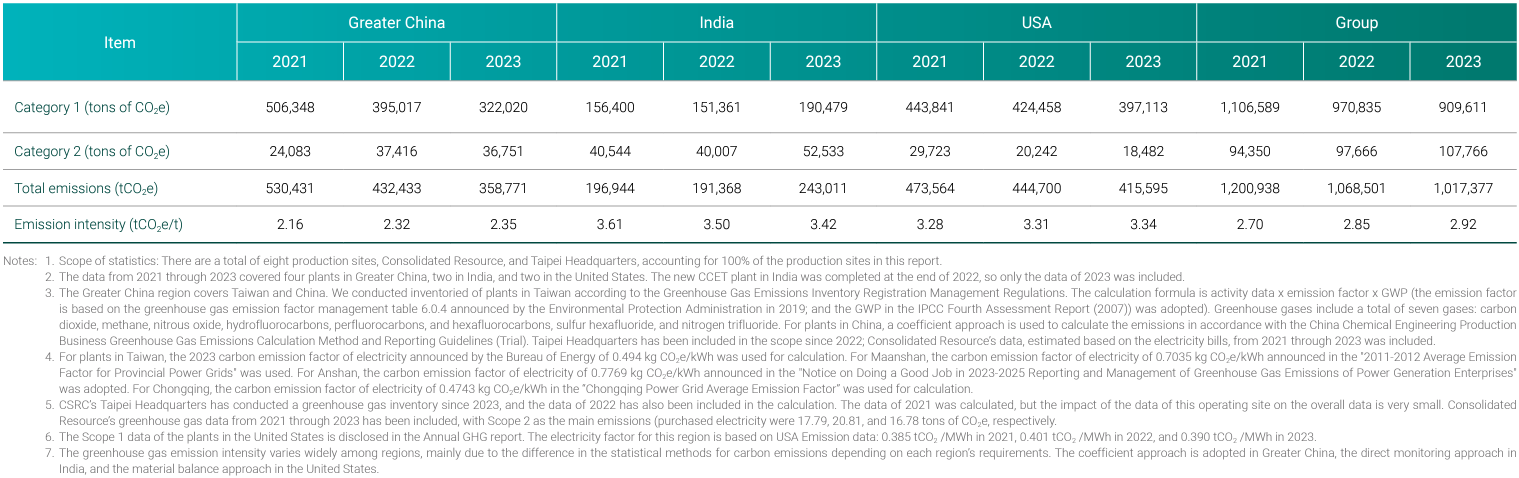
In 2024, CSRC's greenhouse gas emissions totaled 1,035,312 tCO2e, of which Scope 1 emissions were 978,666 tCO2e and Scope 2 emissions were 56,645 tCO2e. In the future, we will continue to pay attention to carbon emission trends, supervise and track the consumption of various energy sources, implement sustainable management concepts and energy conservation and environmental protection policies, to reduce the impact of our business on the environment.
Statistics of GHG emissions in the regions where CSRC operates over the past three years
| Item | Greater China | India | USA | Group | ||||||||
|---|---|---|---|---|---|---|---|---|---|---|---|---|
| 2022 | 2023 | 2024 | 2022 | 2023 | 2024 | 2022 | 2023 | 2024 | 2022 | 2023 | 2024 | |
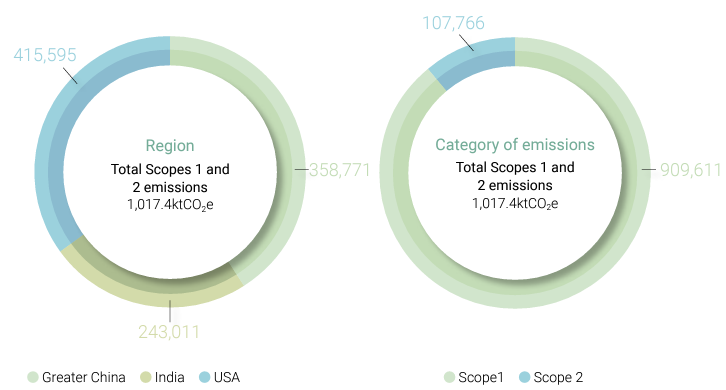
| Scope 1 (tCO₂e) | 395,017 | 322,020 | 311,382 | 151,361 | 190,479 | 284,290 | 424,458 | 397,113 | 382,994 | 970,835 | 909,611 | 978,666 |
| Scope 2 (tCO₂e) | 37,416 | 36,751 | 30,857 | 160 | 11,400 | 7,762 | 20,242 | 18,482 | 18,026 | 57,818 | 66,633 | 56,645 |
| Total emissions (tCO₂e) | 432,433 | 358,771 | 342,239 | 151,521 | 201,879 | 292,053 | 444,700 | 415,595 | 401,020 | 1,028,653 | 976,244 | 1,035,312 |
| Emission intensity (tCO₂e/t) | 2.32 | 2.35 | 2.24 | 2.77 | 2.85 | 2.52 | 3.31 | 3.32 | 3.27 | 2.74 | 2.80 | 2.64 |
- Scope 1 Scope 2 activities: There are a total of eight production sites in Greater China, two in India, and two in the United States, accounting for 100% of the production sites in this report. Taipei Headquarters and Xieyuan are also included.
- The data from 2022 through 2024 covered four plants in Greater China, two in India, and two in the United States. The new CCET plant in India was completed at the end of 2022, so only the data of 2023 and 2024 were included.
- Greater China includes Taiwan and mainland China. For plants in Taiwan, greenhouse gas emissions are inventoried in accordance with the "Greenhouse Gas Emission Registration Method", using the calculation method of activity data × emission factor × GWP value (the emission factors are mainly based on the original coefficients announced by the Intergovernmental Panel on Climate Change (IPCC) in 2006). The GWP values are based on IPCC's Fourth Assessment Report (2007). The greenhouse gases include carbon dioxide, methane, nitrous oxide, hydrofluorocarbons, perfluorocarbons, and hexafluorocarbons, sulfur hexafluoride, and nitrogen trifluoride. For plants in China, a coefficient approach is used to calculate the emissions in accordance with the "China Chemical Engineering Production Guidelines for Greenhouse Gas Emission Accounting Method and Reporting Guidelines for Trial Implementation". The Taipei Headquarters has been included in the scope since 2022. Xieyuan was calculated based on the Taipeh Headquarters, and the GHG emissions of Xieyuan have been estimated based on the electricity bills from 2021 to 2024.
- For plants in Taiwan, the 2023 electricity carbon emission factor of 0.494 kg CO₂e/kWh as announced by the Bureau of Energy was used for calculation. The Maanshan Plant uses the electricity carbon emission factor of 0.5366 kg CO₂e/kWh as announced in the "Announcement on the Release of the Electricity Carbon Dioxide Emission Factor for 2022". The Anshan Plant uses the electricity emission factor of 0.7769 kg CO₂e/kWh as announced in the "Notice on Doing a Good Job in the Reporting and Management of Corporate Greenhouse Gas Emissions in the Power Generation Enterprise in 2023-2025" report. For the Chongqing Plant, it is based on the "Chongqing Power Grid Average Emission Factor", with an electricity coefficient of 0.4743 kg CO₂e/kWh for calculation.
- In the India region, the definition of electricity consumption for 2022–2023 was incorrect, as self-generated and self-consumed electricity was mistakenly included in the calculation. Therefore, the definition was revised in 2024, and the Scope 2 carbon emissions for 2022–2023 were corrected accordingly.
- CSRC's Taipei Headquarters has conducted a greenhouse gas inventory since 2023, and the 2022 data has also been included in the calculation, but the impact of this operating site's data on the overall data is very small. Xieyuan's 2022~2024 greenhouse gas data has been included. The site is mainly based on Scope 2, and the purchased power emissions are 20.81, 16.78, and 18.42 tCO₂e respectively.
- The Scope 1 data for the US region are all disclosed in the Annual GHG report. The electricity factor for the US region is based on USA Emission data: 0.401 tCO₂/MWh in 2022, 0.390 tCO₂/MWh in 2023, and 0.366 tCO₂/MWh in 2024.
- The greenhouse gas emission intensity varies widely among regions, mainly due to the carbon emission statistical methods following the region's requirements. The coefficient approach is adopted in Greater China, the direct monitoring method is used in the India region, and the mass balance method is used in the United States.
- Carbon Emission Intensity Calculation Formula: Total Emissions (tCO₂e) / Carbon Black Production Volume (tons).
In 2024, the greenhouse gas emissions from plants in the Greater China region totaled 342,239 tCO2e, with an emission intensity of 2.24 tCO2e per ton of product. The significant reduction in total emissions was primarily driven by the transition from liquid fuels (fuel oil) to gaseous fuels (natural gas), thereby reducing the use of high-carbon liquid fuels. As a result, Scope 1 emissions— the main source of greenhouse gas emissions— amounted to 311,382 tCO2e. The emissions inventory included sources such as, heavy crude oil, acetylene, diesel, automotive gasoline, liquid fertilizer, and liquefied petroleum gas (LPG). Scope 2 emissions totaled 30,857 tCO2e, originating solely from indirect emissions associated with purchased electricity. The decrease in Scope 2 emissions in 2024 was mainly due to increased use of self-generated electricity compared to 2023.
In 2024, the India region reported greenhouse gas emissions totaling 292,053 tCO2e, with a GHG emission intensity of 2.52 tCO2e per ton of product. Compared to the previous two years, total emissions increased significantly, mainly due to the commissioning of the CCET plant at the end of 2022 and higher production volumes in 2024 compared to 2023. The notable decrease in Scope 2 emissions was primarily due to the increased availability of self-generated tail gas at the India plants in 2024 compared to 2023. As a result, internal power generation through the cogeneration process increased throughout the year, leading to a significant reduction in purchased electricity.
Due to differences in carbon content stemming from variations in carbon emission calculation methods and types of oil products across regions, emissions from plants in the United States are slightly higher than those in Greater China and India. In 2024, greenhouse gas emissions in the U.S. totaled 401,020 tCO2e, with an emission intensity of 3.27 tCO2e per ton of product. The reduction in total carbon emissions compared to 2023 was mainly due to the retubing of air preheaters in the United States, which enhanced the heat exchange efficiency of the heat exchangers and consequently reduced fuel consumption.
Greenhouse Gas Emissions management
Faced with global climate change, CSRC is continuously enhancing the Group’s resilience to climate-related risks and remains committed to mitigating greenhouse gas (GHG) emissions. CSRC conducts annual GHG inventories and formulates management policies based on the inventory results. These policies lead to the establishment of reduction targets and corresponding measures, including replacing traditional energy sources with low-emission alternatives and gradually introducing carbon capture technologies. Based on the GHG emissions and management conditions of each operating site, the Group has set a long-term carbon reduction target of a 21% reduction by 2030 compared to the base year of 2018.
To continually achieve our GHG emission reduction targets, the Group has developed specific strategies addressing both Scope 1 and Scope 2 emissions. For Scope 1 emissions, efforts are focused on enhancing energy efficiency, upgrading process equipment, and setting goals for equipment renewal. Additionally, the Group seeks to reduce crude oil consumption by improving overall production efficiency. In the Greater China region, the Linyuan Advanced Plant and Chongqing Plant transitioned to natural gas as a cleaner alternative to heavy fuel oil in 2023. In order to effectively improve the combustion efficiency of the heating furnace, the Maanshan Plant has upgraded the U6 air preheater and increased the heat exchange area to raise the air inlet temperature, thereby reducing fuel consumption. In the United States, tail gases are utilized to generate steam and electricity for on-site use, supporting energy self-sufficiency and contributing to the energy needs of surrounding communities. In India, the facilities are continuously optimizing process parameters and upgrading the tail gas dryer systems to reduce future dependence on highcarbon fuels.
In terms of Scope 2 emissions reduction, the Linyuan Advanced Plant in Greater China has repurchased solar panels previously operated by Chailease, and is gradually planning to increase the use of renewable energy in the future. At the CCIPL Plant, wind turbine motors have been replaced with high-efficiency models, effectively reducing energy consumption while achieving both economic and emission reduction benefits. In the United States, the facility has re-evaluated and optimized the selection of rotating equipment to enhance operational efficiency. Additionally, the site has partnered with local utility providers to purchase renewable electricity. This strategic shift toward renewable energy serves as a cornerstone of the Group’s GHG mitigation strategy. Moving forward, the Group will actively explore opportunities to integrate more renewable energy sources into its operations.
To effectively achieve greenhouse gas emissions reduction targets, the Group has established a Carbon Management Task Force comprising members from the Technology Department, the EHS Department, and representatives from each operating site. In the Greater China region, a crosssite digital carbon emission monitoring system has been implemented, allowing real-time tracking of carbon emissions. Each month, CSRC calculates the financial impact based on local carbon pricing, providing this information to each site for review and improvement. Globally, CSRC holds regular meetings to review and track GHG emissions, with progress reports submitted to the Board of Directors. In addition, each plant is encouraged to share its emission reduction initiatives and performance results, fostering mutual learning among sites. The Greater China region has also incorporated monthly and quarterly GHG emission intensity figures into each plant’s key performance indicators (KPIs), which are linked to performance bonuses. This approach aims to motivate all employees to actively contribute to energy conservation and emission reduction efforts.
CSRC Carbon Management System
To realize the concept of environmental sustainability, CSRC has continuously invested in various environmental projects in recent years. In order to further advance the low-carbon transition, the company has allocated budgets specifically for greenhouse gas management initiatives, promoting short-, medium-, and long-term low-carbon transition pathways. Progress and outcomes are regularly reported to the Board of Directors.
Roadmap for low-carbon transition of CSRC
- The Group’s baseline year is adjusted to 2018 to align with the inclusion of the plants in the United States and India in the scope.
- The Scopes 1 and 2 emissions of all production sites are included in this report.
- The increase in total emissions in 2024 compared to 2023 is mainly due to the higher production volume at the India CCET plant in 2024
These three projects collectively reduced carbon emissions by about 18,178 tCO2e in 2024. CSRC will continue advancing process and equipment technological upgrades, aiming not only to lower production costs but also to contribute to CO2 emission reductions, fulfilling our commitment to carbon mitigation.
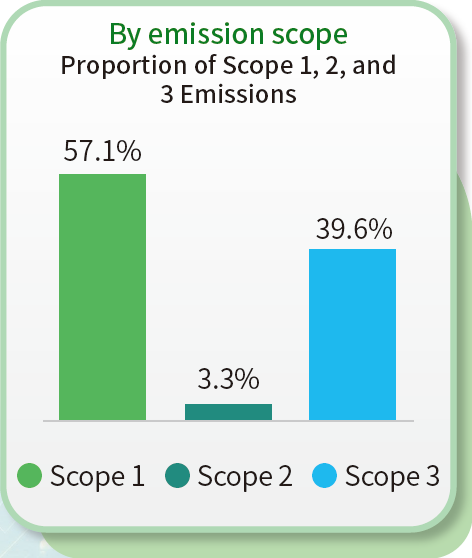
CSRC currently adheres to the ISO 14064 standard to conduct carbon inventory for significant Scope 3 emission sources. Scope 3 emissions in the Greater China region amount to 195,495 tCO2e, 208,403 tCO2e in India region, and 276,251 tCO2e in the United States region. Altogether, Scope 3 emissions account for approximately 39.6% of the Group’s total carbon emissions. Following this inventory of significant Scope 3 categories, the Group will also undertake a comprehensive review of non-significant Scope 3 items to gain a clear understanding of carbon emissions across all plants. Moving forward, the Group will continue to pursue technological upgrades and process optimization to reduce specific oil consumption and improve energy efficiency, thereby lowering carbon emissions across all scopes.