CSRC regards talent as a crucial factor in corporate development, adhering to the principles of placing talent appropriately and employing solely based on merit. We do not consider an individual's race, color, religion, gender, age, ethnicity, sexual orientation, disability, nationality, or marital status. In line with our global strategy and commitment to sustainable operations, we actively recruit outstanding talent to meet the challenges of the new century and jointly explore new milestones of excellence.
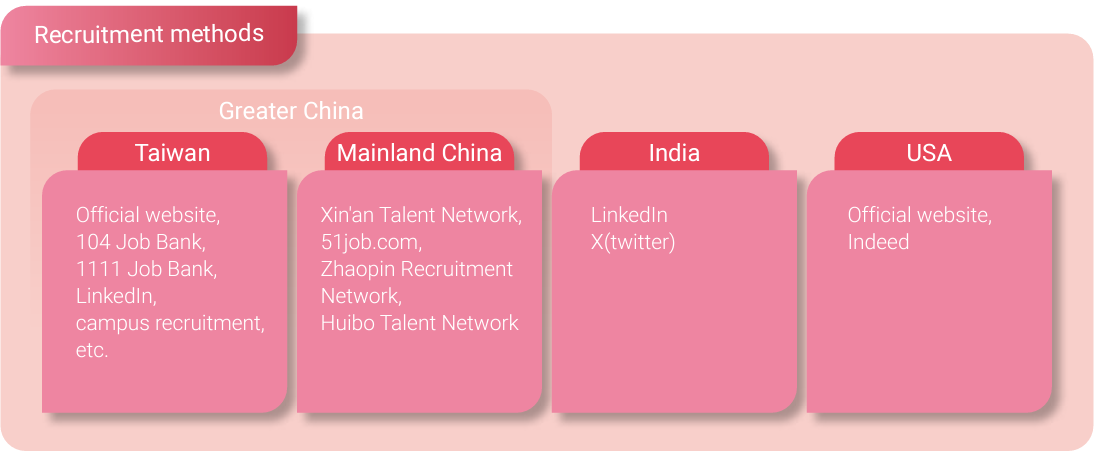
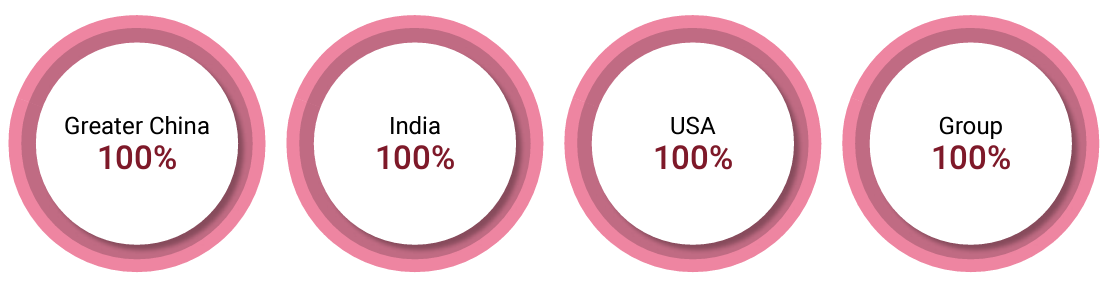
CSRC locations worldwide are recruiting personnel in accordance with the “Regulations on Recruitment and Appointment of Newcomers.” The recruitment process includes talent demand application, talent selection, admission, and On-board. We advertise recruitment openly through the CSRC official website, job banks, Linkedin, and campus recruitment events. We also offer employee introduction incentives. After opening recruitment needs, we encourage colleagues to recommend outstanding individuals to join the Company. We have also engaged external management consulting firms for recruitment, with the recruitment fees paid by CSRC. In addition, CSRC is committed to cultivating talent in product development and application research, global business management, and upstream and downstream supply chain management to meet the evolving demands of global markets and their supply chains. The labor contract signing coverage rate in each region is 100%.
Recruitment methods
Employee labor contract signing coverage ratio in each CSRC region
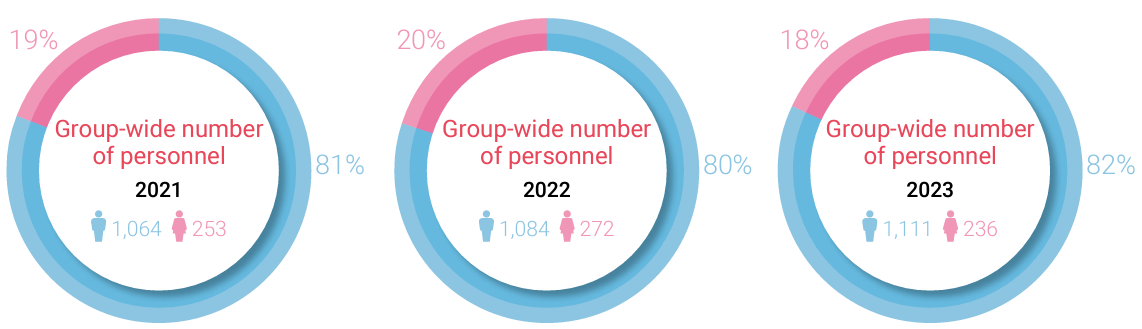
As of the end of 2024, the total number of employees in the Group was 1,342. Due to the characteristics of the industry, the majority of employees are male, accounting for 83%. Common types of non-employee workers in CSRC Group in 2024 included cleaning staff, security guards, packers, etc., totaling 737 individuals. Additionally, CSRC values workforce diversity. In 2024, the Group's employment of physically and mentally handicapped individuals exceeded statutory standard appointment quotas.
Gender ratio of CSRC employees
Employee structure by gender, region, and employment contract, 2024
| Region | Greater China | India | USA | Group | ||||||||||
|---|---|---|---|---|---|---|---|---|---|---|---|---|---|---|
| Age | <30 years old | 30-50 years old | >50 years old | <30 years old | 30-50 years old | >50 years old | <30 years old | 30-50 years old | >50 years old | <30 years old | 30-50 years old | >50 years old | ||
| Male | Regular position | Full time | 53 | 321 | 101 | 137 | 214 | 22 | 57 | 93 | 43 | 247 | 628 | 166 |
| Contract position | Full time | 14 | 48 | 8 | 0 | 0 | 0 | 0 | 0 | 0 | 14 | 48 | 8 | |
| Total males | 67 | 369 | 109 | 137 | 214 | 22 | 57 | 93 | 43 | 261 | 676 | 174 | ||
| Female | Regular position | Full time | 18 | 118 | 6 | 9 | 12 | 1 | 7 | 16 | 13 | 34 | 146 | 20 |
| Contract position | Full time | 4 | 27 | 0 | 0 | 0 | 0 | 0 | 0 | 0 | 4 | 27 | 0 | |
| Total females | 22 | 145 | 6 | 9 | 12 | 1 | 7 | 16 | 13 | 38 | 173 | 20 | ||
Numbers and proportions of new employees, 2024
| Greater China | India | USA | Group | ||||||
|---|---|---|---|---|---|---|---|---|---|
| Number of personnel | Proportion | Number of personnel | Proportion | Number of personnel | Proportion | Number of personnel | Proportion | ||
| <30 years old | Male | 13 | 1.17% | 52 | 4.68% | 54 | 4.86% | 119 | 10.71% |
| Female | 4 | 1.73% | 5 | 2.16% | 7 | 3.03% | 16 | 6.93% | |
| Subtotal | 17 | 1.27% | 57 | 4.25% | 61 | 4.55% | 135 | 10.06% | |
| 31-50 years old | Male | 25 | 2.25% | 50 | 4.50% | 42 | 3.78% | 117 | 10.53% |
| Female | 7 | 3.03% | 3 | 1.30% | 3 | 1.10% | 13 | 5.63% | |
| Subtotal | 32 | 2.38% | 53 | 3.95% | 45 | 3.35% | 130 | 9.69% | |
| >51 years old | Male | 4 | 0.36% | 3 | 0.27% | 1 | 0.09% | 8 | 0.72% |
| Female | 0 | 0% | 0 | 0% | 1 | 0.43% | 1 | 0.43% | |
| Subtotal | 4 | 0.30% | 3 | 0.22% | 2 | 0.15% | 9 | 0.67% | |
| Total | 53 | 3.95% | 113 | 8.42% | 108 | 8.05% | 274 | 20.42% | |
Numbers and proportions of employees departing, 2024
| Greater China | India | USA | Group | ||||||
|---|---|---|---|---|---|---|---|---|---|
| Number of personnel | Proportion | Number of personnel | Proportion | Number of personnel | Proportion | Number of personnel | Proportion | ||
| <30 years old | Male | 15 | 1.35% | 29 | 2.61% | 40 | 3.60% | 84 | 7.56% |
| Female | 8 | 3.46% | 2 | 0.87% | 6 | 2.60% | 16 | 6.93% | |
| Subtotal | 23 | 1.71% | 31 | 2.31% | 46 | 3.43% | 100 | 7.45% | |
| 31-50 years old | Male | 45 | 4.05% | 43 | 3.87% | 45 | 4.05% | 133 | 11.97% |
| Female | 16 | 6.93% | 3 | 1.30% | 2 | 0.87% | 21 | 9.09% | |
| Subtotal | 61 | 4.55% | 46 | 4.33% | 47 | 3.50% | 154 | 11.48% | |
| >51 years old | Male | 10 | 0.90% | 10 | 0.90% | 8 | 0.72% | 28 | 2.52% |
| Female | 1 | 0.43% | 0 | 0% | 2 | 0.87% | 3 | 1.30% | |
| Subtotal | 11 | 0.82% | 10 | 0.75% | 10 | 0.75% | 31 | 2.31% | |
| Total | 95 | 7.08% | 87 | 6.48% | 103 | 7.68% | 285 | 21.24% | |
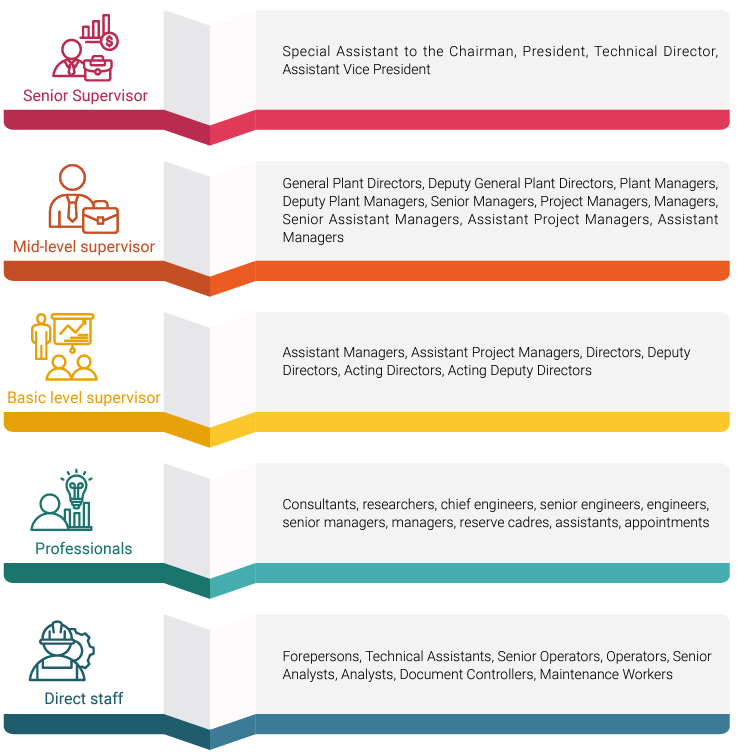
Employee type
Diversity
Proportions of minority or disadvantaged groups employed by CSRC in the past three years
| Greater China | India | USA | Group | ||
|---|---|---|---|---|---|
| 2022 | Number of personnel | 8 | 0 | 121 | 129 |
| Proportion | 1.0% | 0.0% | 46.7% | 11% | |
| 2023 | Number of personnel | 9 | 0 | 110 | 119 |
| Proportion | 1.2% | 0.0% | 48.7% | 9% | |
| 2024 | Number of personnel | 9 | 0 | 108 | 117 |
| Proportion | 1.3% | 0.0% | 47.2% | 8.7% | |
CSRC's proportions of minorities or disadvantaged groups in middle and senior management positions in the past three years
| Greater China | India | USA | Group | ||
|---|---|---|---|---|---|
| 2022 | Number of personnel | 1 | 0 | 2 | 3 |
| Proportion | 13% | 0.0% | 1.7% | 2% | |
| 2023 | Number of personnel | 1 | 0 | 2 | 3 |
| Proportion | 11% | 0.0% | 1.8% | 3% | |
| 2024 | Number of personnel | 1 | 0 | 0 | 1 |
| Proportion | 11.1% | 0.0% | 0.0% | 5.0% | |
CSRC's proportions of women in senior management positions in the past three years
| Greater China | India | USA | Group | ||
|---|---|---|---|---|---|
| 2022 | Number of personnel | 2 | 0 | 2 | 4 |
| Proportion | 29% | 0.0% | 22% | 25% | |
| 2023 | Number of personnel | 1 | 0 | 2 | 3 |
| Proportion | 17% | 0.0% | 25% | 21% | |
| 2024 | Number of personnel | 1 | 0 | 0 | 1 |
| Proportion | 8% | 0.0% | 0.0% | 7% | |